How to review the timeline and understand how the trip was executed
If your business has integrated both events and locations functionality, you can monitor trip execution in real-time using the Gantt view. Specifically, order markers on the timeline are marked in different colours to represent their delivery status.
This means that an operations department can quickly spot any constrained trips and intervene where possible to resolve or prevent further delays on the delivery day. Or you can retrospectively inspect historical trips to better understand where and why any delays where caused.
1. Key markers for Gantt View:
When reviewing a timeline in Gantt view, look out for:
Drop off order - a box with arrow pointing down.
Pick up order - a box with arrow pointing up.
Exchange order - an order where both actions happen at the same delivery location: an item is being dropped off and another item is picked up. This is represented in a box with two arrows - one pointing up, another pointing down.

Break - a scheduled rest for drivers.

Reload - the vehicle is routed back to the depot to add (or remove) additional items.

Break as reload - a designated time when drivers take a break at the depot, during which additional items are loaded onto the vehicle.

Completed orders are marked in green.

Completed but late orders are marked in orange.

Skipped (or failed to deliver) orders are marked in red.

2. Schedule execution
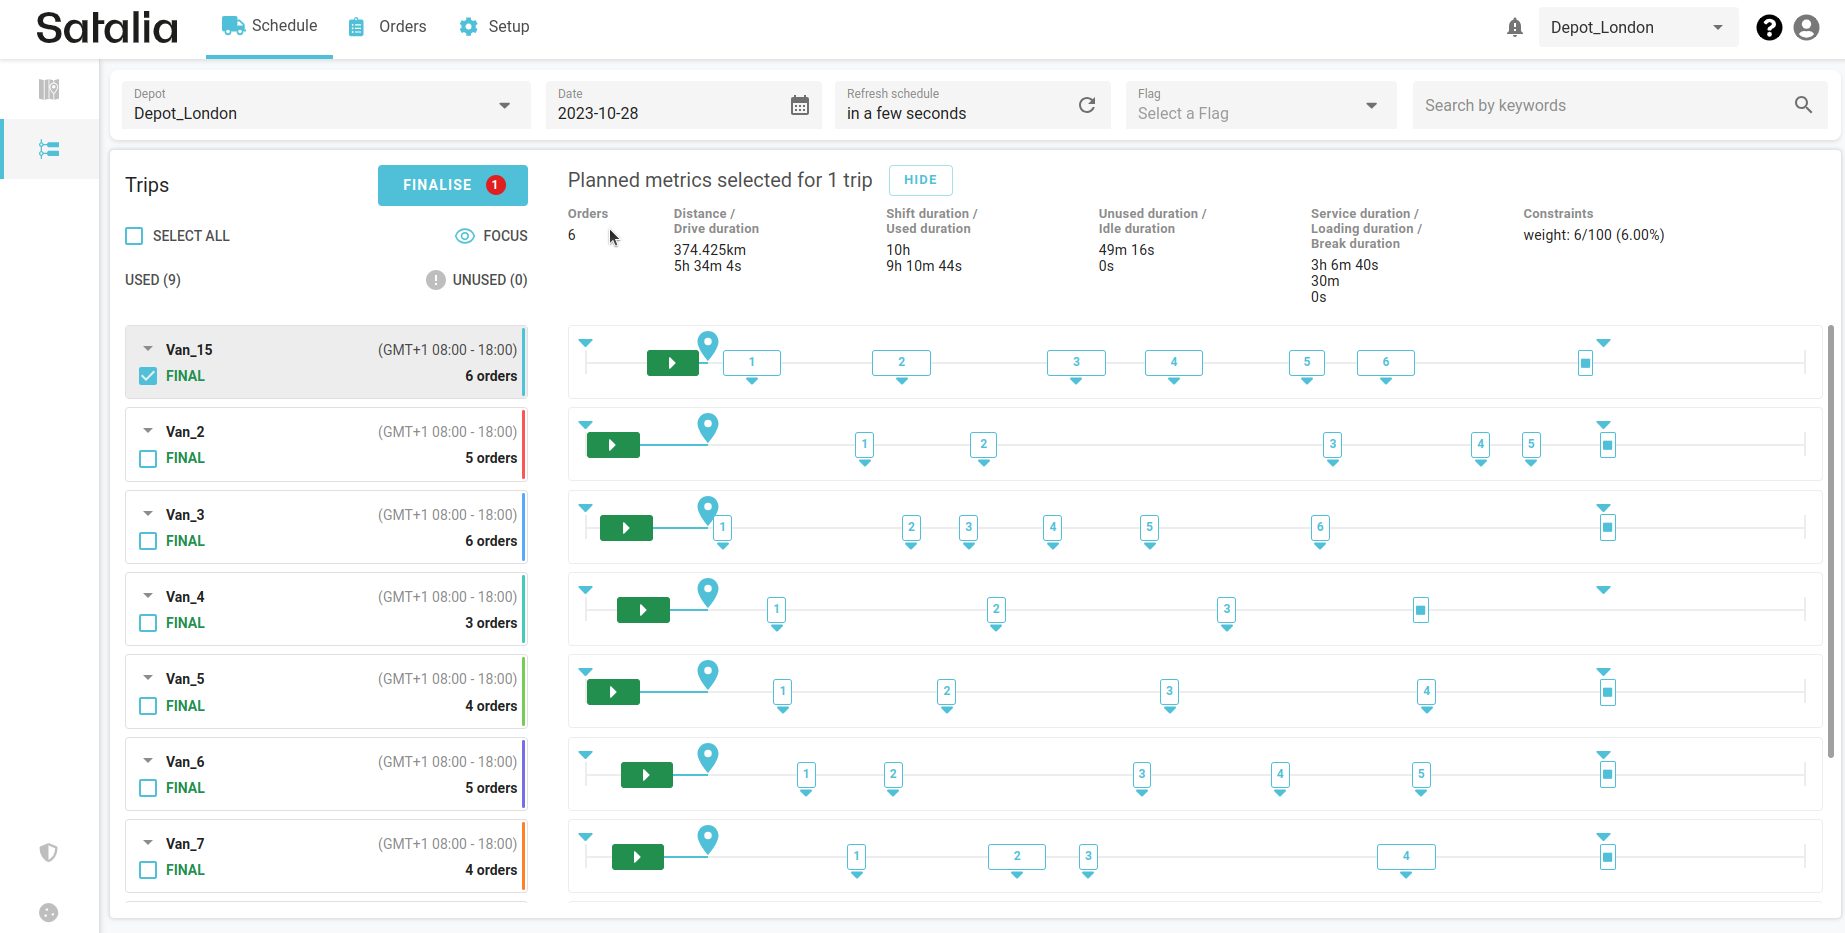
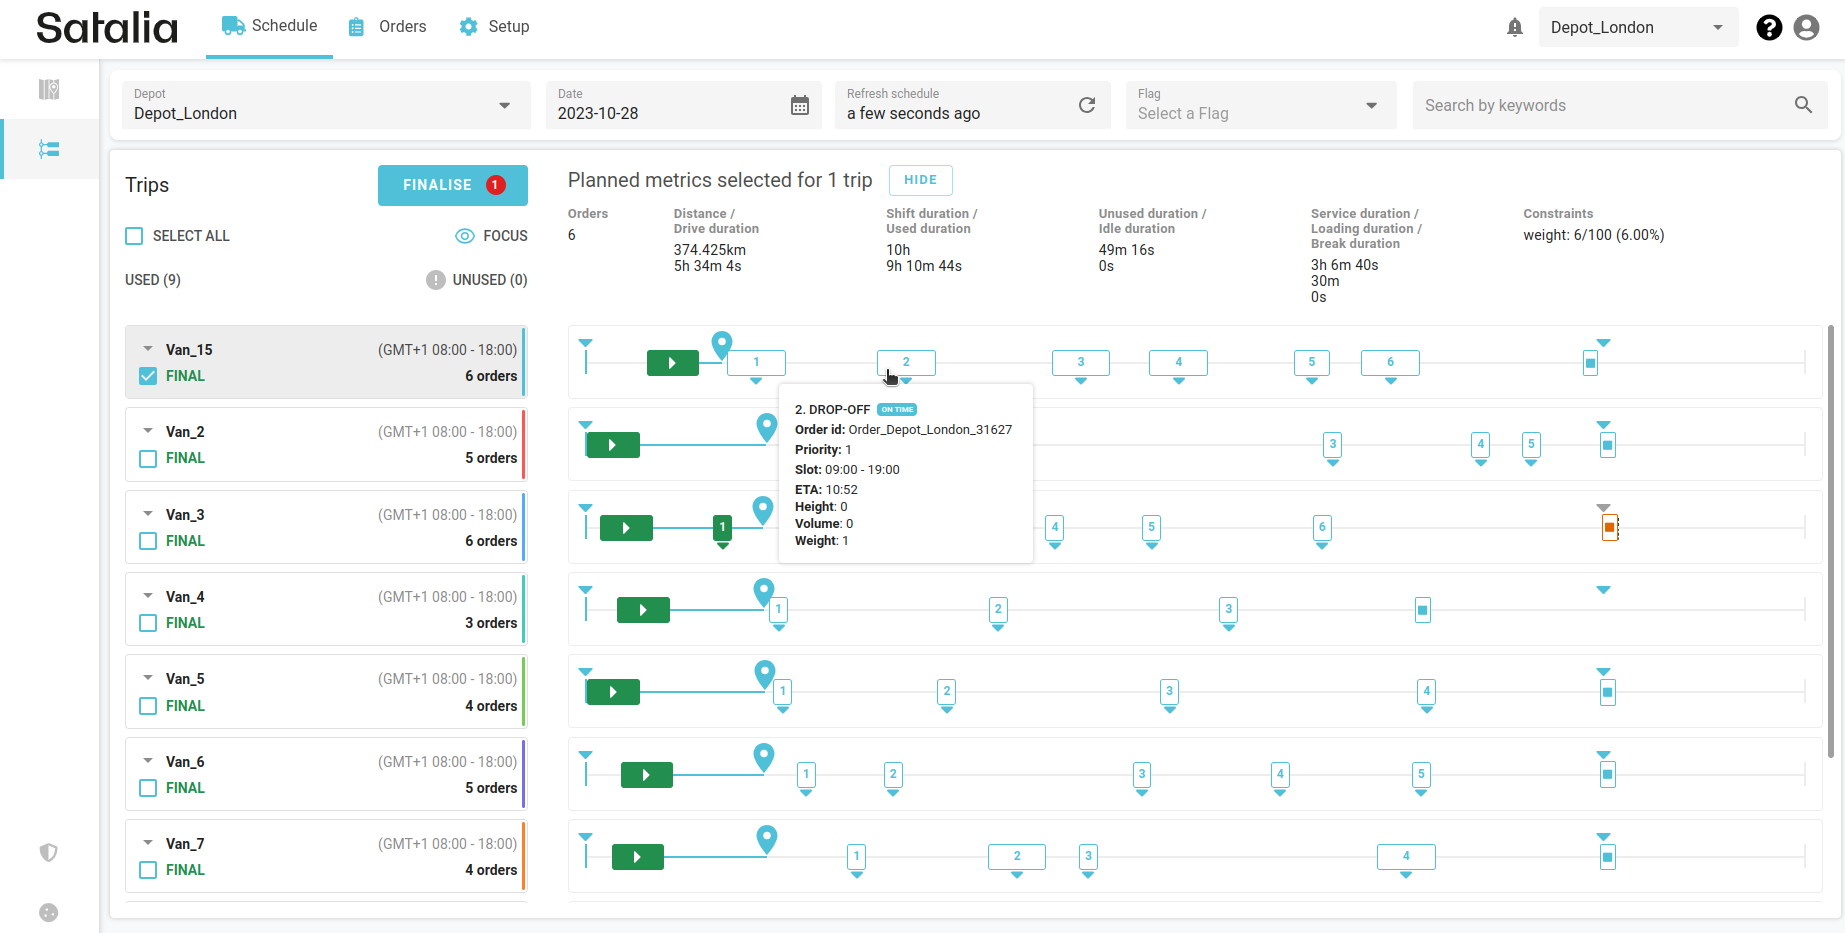
In the example below a blue pin on the Gantt line indicates the time of the last vehicle’s GPS ping (when they are available).

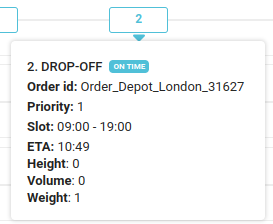
When you click on the order icon, detailed information about the order will be displayed:

Additionally, the estimated time of arrival (ETA) is continuously updated as the vehicle progresses through the trip. In the example above, the ETA was 10:49, but in the example below, it has changed to 10:52 due to a new location ping. Monitoring the ETA helps you anticipate when the current order will be delivered.

If, for instance, a vehicle is significantly delayed due to a traffic jam, orders will be shifted to the new ETA slots. The borders around the box will then switch to orange to indicate predicted lateness. Additionally, a grey icon appears near their original delivery time. This helps you to gauge the extent of the delay and estimate the extra time until the orders are delivered.
The example below shows that the three last orders will be delivered after the shift ends.

In the new example below, it shows that the last two orders were delivered outside their scheduled time slots. This is why they are marked in orange. For example, order number five had a time slot at 09:00 - 19:00, but instead it was completed at 21:15.
If you click on the orders, you’ll see information indicating that while the orders were completed they were late.

