
1. What is the Reporting Dashboard
The reporting dashboard within the Control Room gives you access to the following information based on the day or date range defined in the filter and can be across a single depot or multiple depots:
-
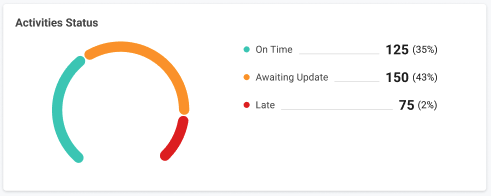
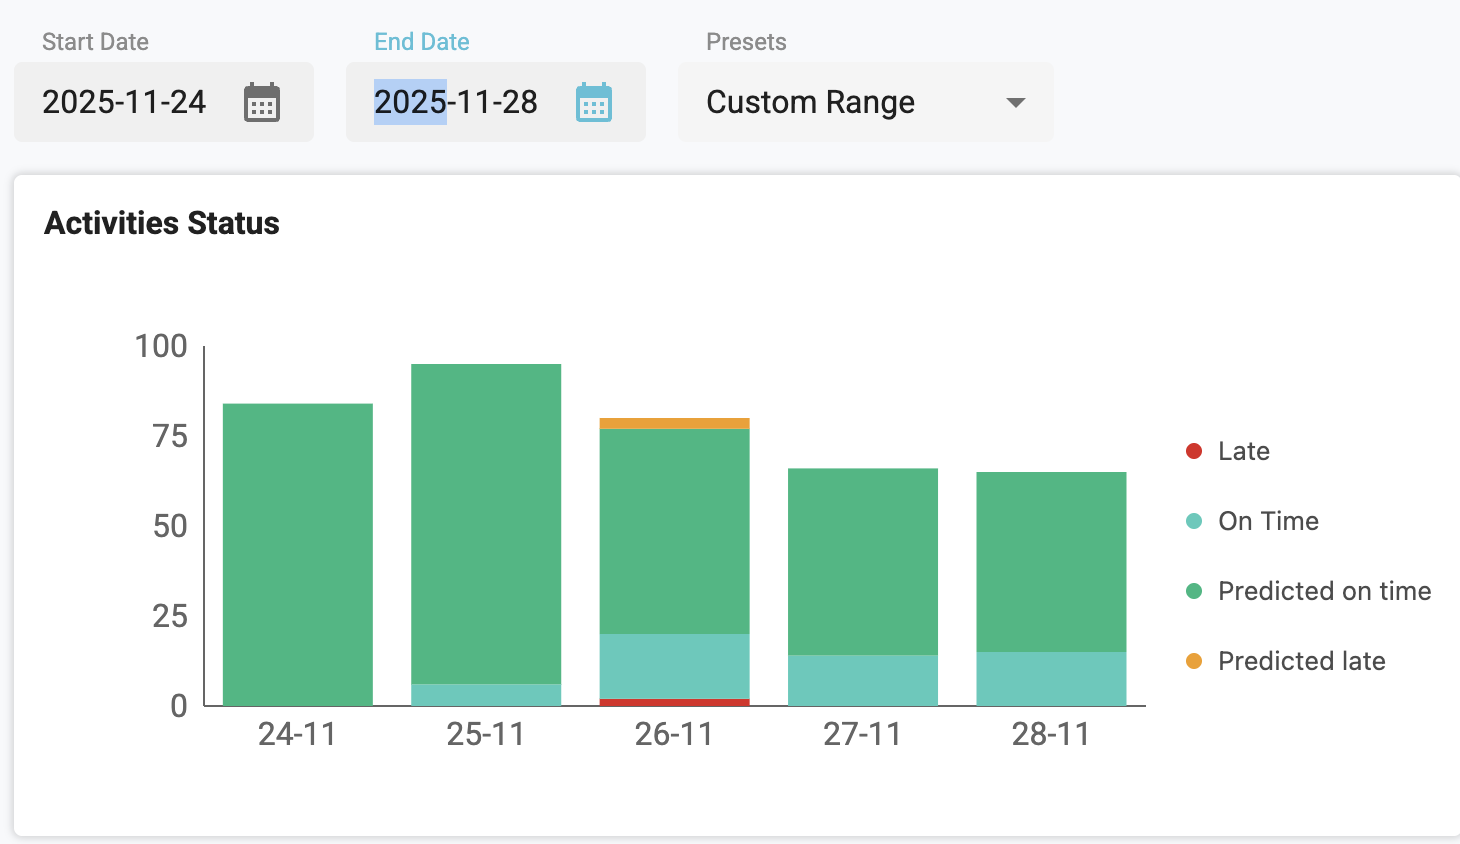
Activities Status
-
This can provide insight into the current status of your orders for the current day provided the events tracking data is being shared with Satalia via the APIs
-
Whilst also being able to provide a historic view of your order data
-
Current Day Data View:
Historic Data View:
-
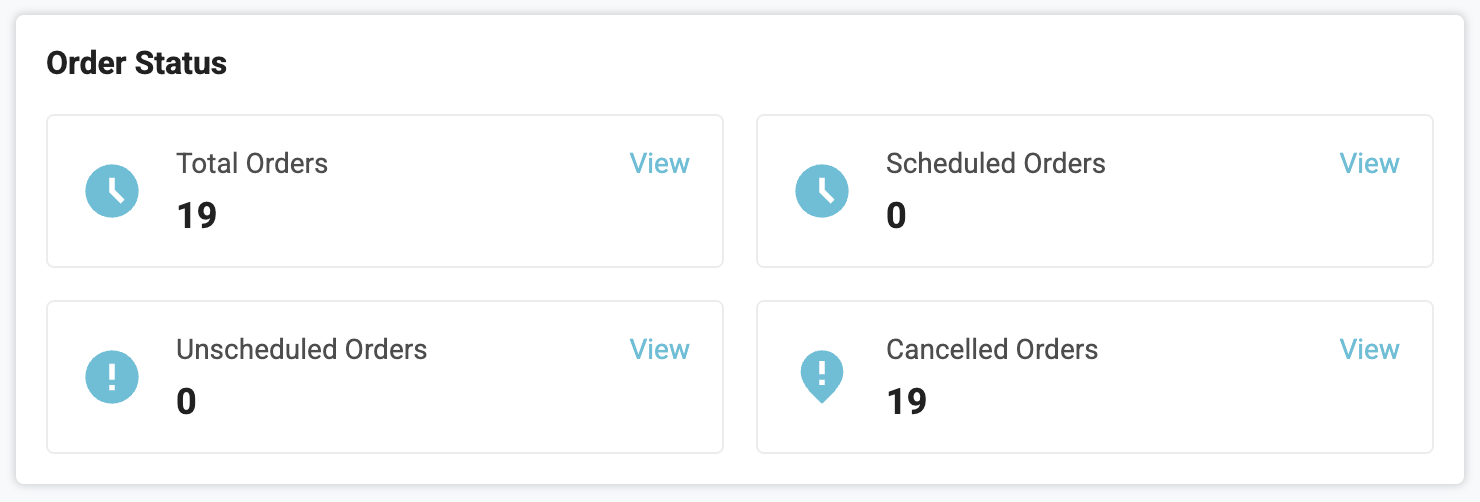
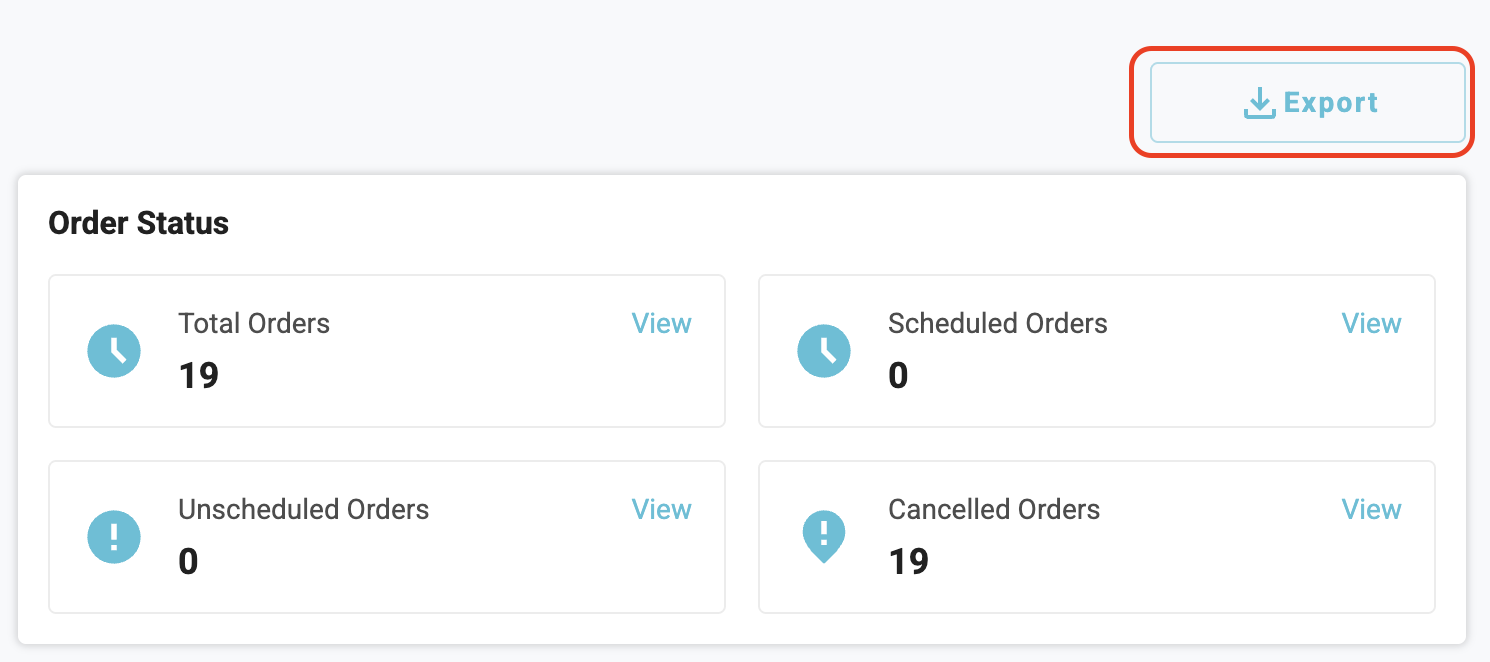
Order Status
-
Provides a summary of the total number of orders for your specified location/s and date range with the following information:
-
Total Orders
-
Scheduled Orders
-
Unscheduled Orders
-
Cancelled Orders
-
-
-
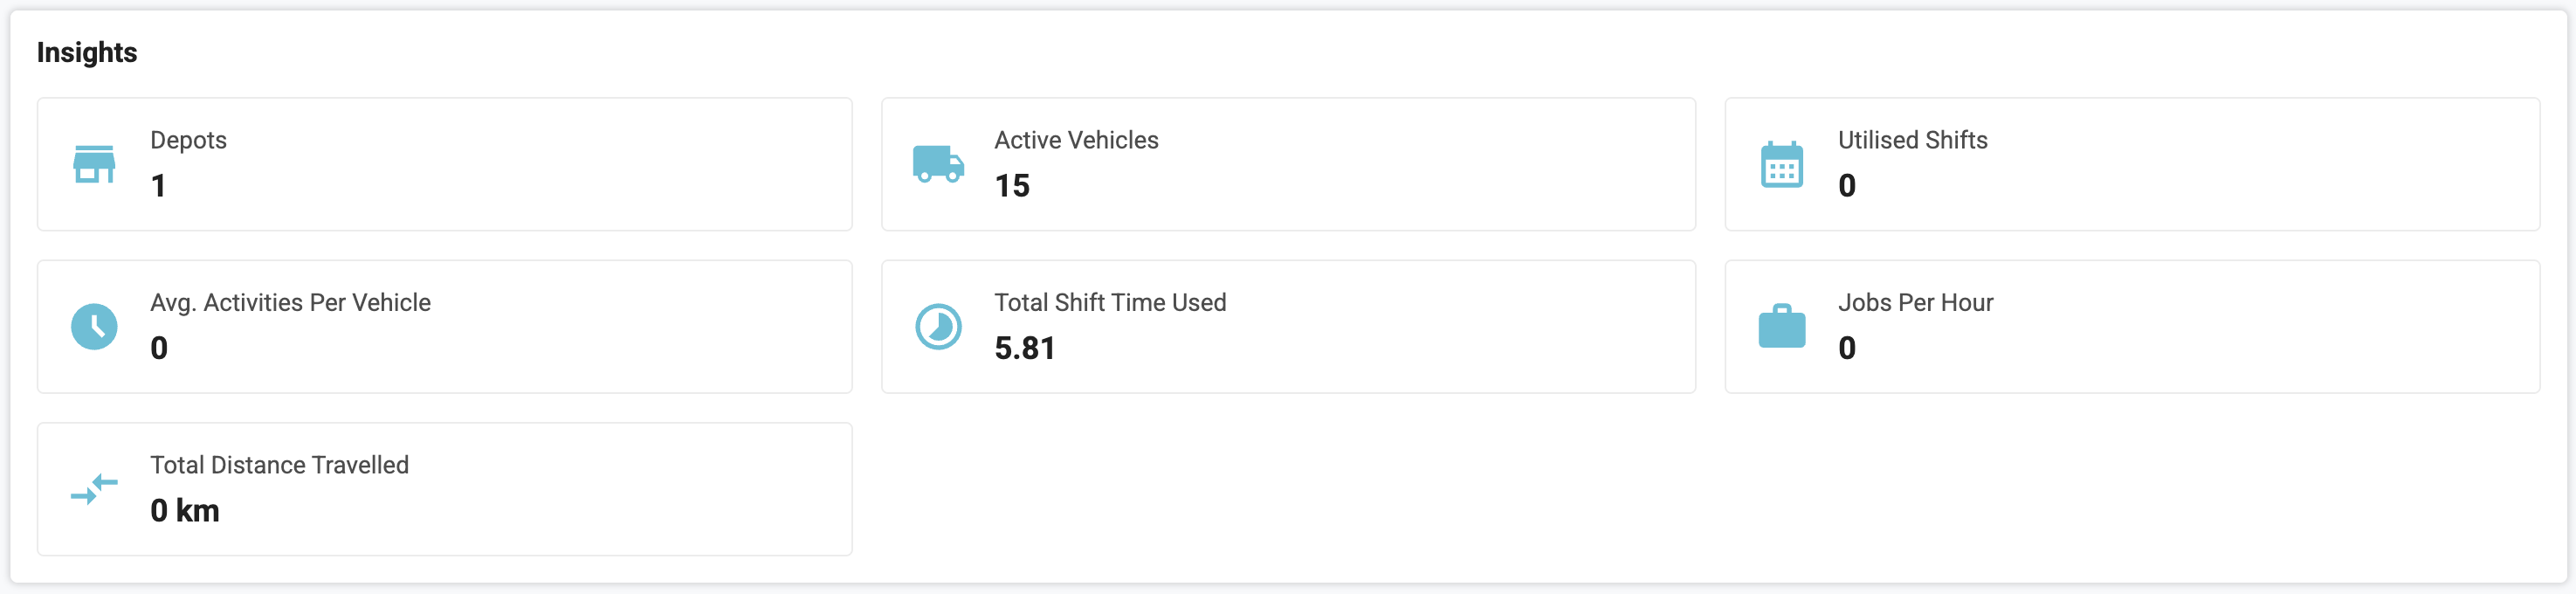
Insights
-
Provides operational insight into your specified location/s providing the following information for your specified location/s and date range:
-
Depots
-
Active Vehicles
-
Utilised Shifts
-
Avg Activities Per Vehicle
-
Total Shift Time Used
-
Jobs Per Hour
-
Total Distance Travelled
-
-
-
Data Export
-
You will also have the facility to export the underlying data set from the reporting dashboard into a CSV File for consumption in your own reporting suite outside of the Satalia Delivery Platform.
-
2. Accessing the Reporting Dashboard
To access the Reporting Dashboard you simply need to click on the reporting option in the navigation bar at the top of the Control Room. This will then load the reporting dashboard and render the data based on your selected depots. Note that where users only have access to certain depots and not all then this will also be honoured within the reporting dashboard.
